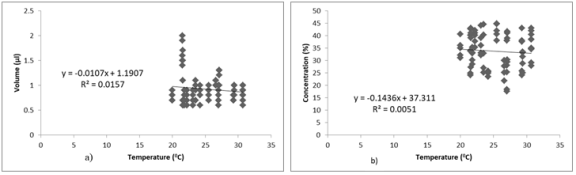
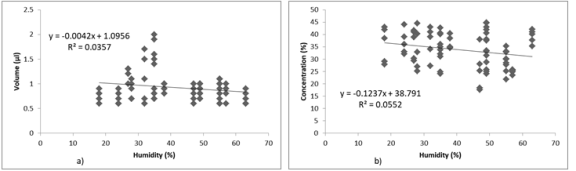
Ethiopia's beekeeping industry benefits immensely from the diverse range of plant species that are supported by the country's ideal environment. However, different plant species produce different amounts of nectar, which has a direct impact on how much honey is produced. Many factors, such as flower shape, flower morphology, flowering phenology, and the amount and quality of nectar produced, affect how much each plant species contributes to the production of honey. The quality and amount of nectar are also greatly influenced by environmental factors such as temperature, humidity, wind speed, and sunlight. Measuring nectar production in relation to these climates parameters is essential. Knowing how much honey each blooming plant species can produce is important for determining how they affect beehive productivity and for guiding management plans for forests and watersheds. Therefore, this study was aimed to quantify the dynamics of nectar secretion and the honey production potential of Leucas abyssinica. To measure the accumulated nectar volume, a set of flowers was enclosed with mesh bags one day before nectar collection. Nectar volume, concentration, temperature, and humidity were recorded at 4-hour intervals. It was adjusted according to the flower size the species. The collected data were analyzed using one-way ANOVA and linear regression. The results showed significant differences (at p < 0.05) in nectar secretion dynamics at various times of the day. The volume of nectar available between consecutive measurements ranged from from 0.78 to 1.04 (µl) per flower. Nectar concentration varied throughout the day, ranging from 30.35% to 36.79%. Temperature and humidity were negatively correlated with nectar volume and concentration. Based on the average nectar sugar content, the mean honey production potential was estimated at 32.2 kg/ha, with a maximum potential of 110 kg/ha. These findings suggest that L. abyssinica have substantial honey production potential. Therefore, promoting the planting and in-situ conservation of this plant species is recommended to support sustainable honey production.
| Published in | American Journal of Bioscience and Bioengineering (Volume 13, Issue 3) |
| DOI | 10.11648/j.bio.20251303.11 |
| Page(s) | 28-34 |
| Creative Commons |
This is an Open Access article, distributed under the terms of the Creative Commons Attribution 4.0 International License (http://creativecommons.org/licenses/by/4.0/), which permits unrestricted use, distribution and reproduction in any medium or format, provided the original work is properly cited. |
| Copyright |
Copyright © The Author(s), 2025. Published by Science Publishing Group |
Concentration, Humidity, Sugar, Temperature, Volume
Time (hr) | Volume ± SE (μl) | Concentration (%) ± SE |
|---|---|---|
10:00 | 1.04 + 0.07a | 30.35 + 1.32b |
14:00 | 0.92 + 0.04ab | 34.57 + 1.19a |
18:00 | 0.78 + 0.03b | 36.79 + 1.15a |
Overall Mean | 0.92 + 0.03 | 33.68 + 0.77 |
Parameters | Mean + SE | Minimum | Maximum |
|---|---|---|---|
Inflorescences per plant | 17.00 + 2.00 | 8.00 | 42.00 |
Flowers per plant | 2062.00 + 203.83 | 238.00 | 2720.00 |
Flowers/m2 | 4124.00 + 407.32 | 952.00 | 10880.00 |
Flowers per ha | 41,218,462.00 + 4073005.52 | 9520,000.00 | 108,800,000.00 |
Nectar volume (μl)/24 hours | 0.78 + 0.04 | 0.60 | 1.20 |
Nectar secretion length (Day) | 8 + 0.40 | 6.00 | 9.00 |
Parameters | Mean ± SE | Minimum | Maximum |
|---|---|---|---|
Sugar (mg)/flower | 0.32 + 0.01 | 0.11 | 0.82 |
Honey (mg)/flower | 0.39 + 0.02 | 0.13 | 1.01 |
Sugar (g)/plant | 0.66 + 0.02 | 0.03 | 2.23 |
Honey (g)/plant | 0.80 + 0.04 | 0.03 | 2.75 |
Sugar (kg)/ha | 26.4 + 0.82 | 1.04 | 89.20 |
Honey (kg)/ha | 32.2 + 1.00 | 1.30 | 110.00 |
ANOVA | Analysis of Variance |
IPP | Inflorescences per Plant |
FPI | Flowers per Inflorescences |
FPP | Flower per Plant |
FPH | Flowers per Hectare |
SE | Standard Error |
| [1] | Fichtl, R. and A. Adi, Honeybee flora of Ethiopia. 1994. |
| [2] | Adi, A., et al., Honeybee forages of Ethiopia. Holeta Bee Research Center, Addis Ababa, Ethiopia, 2014. |
| [3] | Obeng-Darko, S. A., et al., Dihydroxyacetone in the floral nectar of Ericomyrtus serpyllifolia (Turcz.) Rye (Myrtaceae) and Verticordia chrysantha Endl. (Myrtaceae) demonstrates that this precursor to bioactive honey is not restricted to the genus Leptospermum (Myrtaceae). Journal of Agricultural and Food Chemistry, 2023. 71(20): p. 7703-7709. |
| [4] | Abro, Z., et al., The impact of beekeeping on household income: evidence from north-western Ethiopia. Heliyon, 2022. 8(5). |
| [5] | Bareke, T. and A. Addi, Bee flora resources and honey production calendar of Gera Forest in Ethiopia. Asian Journal of Forestry, 2019. 3(2). |
| [6] | Bareke, T., T. Kumsa, and A. Addi, Nectar secretion and honey production potential of Schefflera abyssinica (Hochst. ex A. Rich.) Harms, Araliaceae. Tropical Agriculture, 2020. 97(3). |
| [7] | Galetto, L. and G. Bernardello, Floral nectaries, nectar production dynamics and chemical composition in six Ipomoea species (Convolvulaceae) in relation to pollinators. Annals of botany, 2004. 94(2): p. 269-280. |
| [8] | Bertazzini, M. and G. Forlani, Intraspecific variability of floral nectar volume and composition in rapeseed (Brassica napus L. var. oleifera). Frontiers in plant science, 2016. 7: p. 288. |
| [9] | Alqarni, A. S., A. M. Awad, and A. A. Owayss, Evaluation of Acacia gerrardii Benth. (Fabaceae: Mimosoideae) as a honey plant under extremely hot-dry conditions: flowering phenology, nectar yield and honey potentiality. 2015. |
| [10] | Bareke, T., et al., Dynamics of nectar secretion, honey production potential and colony carrying capacity of Coffea arabica L., Rubiaceae. Journal of Agriculture and Environment for International Development (JAEID), 2021. 115(1): p. 125-138. |
| [11] | Dafni, A., Pollination ecology: a practical approach. 1992. |
| [12] | Bareke, T. and A. Addi, Quantifying nectar secretion potential of Hygrophila auriculata (Schum.), Heine (Acanthaceae), and Salvia leucantha Cav. (Lamiaceae) for honey production. Advances in Agriculture, 2022. 2022(1): p. 8301903. |
| [13] | Adgaba, N., et al., Nectar secretion dynamics and honey production potentials of some major honey plants in Saudi Arabia. Saudi Journal of Biological Sciences, 2017. 24(1): p. 180-191. |
| [14] | Wyatt, R., S. B. Broyles, and G. S. Derda, Environmental influences on nectar production in milkweeds (Asclepias syriaca and A. exaltata). American Journal of Botany, 1992. 79(6): p. 636-642. |
| [15] | Esteves, R. J. P., M. C. Villadelrey, and J. F. Rabajante, Determining the optimal distribution of bee colony locations to avoid overpopulation using mixed integer programming. Journal of Nature Studies, 2010. 9(1): p. 79-82. |
| [16] | Prys-Jones, O. and S. Corbet, Naturalists’ Handbooks 6: Bumblebees. Slough: Richmond Publishing Co. Ltd, 1991. |
| [17] | Kim, S.-H., et al., Analysis of floral nectar characteristics of Korean and Chinese hawthorns (Crataegus pinnatifida Bunge). Journal of Apicultural Research, 2018. 57(1): p. 119-128. |
| [18] | BAREKE, T. and A. ADDI, Floral nectar secretion dynamics of Pavonia Urens (Malvaceae) and honey production potential. Nusantara Bioscience, 2024. 16(1). |
APA Style
Lema, S. D., Bareke, T., Addi, A. (2025). Floral Nectar Secretion Dynamics and Honey Production Potential of Leucas abyssinica (LAMIACEAE). American Journal of Bioscience and Bioengineering, 13(3), 28-34. https://doi.org/10.11648/j.bio.20251303.11
ACS Style
Lema, S. D.; Bareke, T.; Addi, A. Floral Nectar Secretion Dynamics and Honey Production Potential of Leucas abyssinica (LAMIACEAE). Am. J. BioSci. Bioeng. 2025, 13(3), 28-34. doi: 10.11648/j.bio.20251303.11
AMA Style
Lema SD, Bareke T, Addi A. Floral Nectar Secretion Dynamics and Honey Production Potential of Leucas abyssinica (LAMIACEAE). Am J BioSci Bioeng. 2025;13(3):28-34. doi: 10.11648/j.bio.20251303.11
@article{10.11648/j.bio.20251303.11,
  author = {Shimu Debela Lema and Tura Bareke and Admassu Addi},
  title = {Floral Nectar Secretion Dynamics and Honey Production Potential of Leucas abyssinica (LAMIACEAE)
},
  journal = {American Journal of Bioscience and Bioengineering},
  volume = {13},
  number = {3},
  pages = {28-34},
  doi = {10.11648/j.bio.20251303.11},
  url = {https://doi.org/10.11648/j.bio.20251303.11},
  eprint = {https://article.sciencepublishinggroup.com/pdf/10.11648.j.bio.20251303.11},
  abstract = {Ethiopia's beekeeping industry benefits immensely from the diverse range of plant species that are supported by the country's ideal environment. However, different plant species produce different amounts of nectar, which has a direct impact on how much honey is produced. Many factors, such as flower shape, flower morphology, flowering phenology, and the amount and quality of nectar produced, affect how much each plant species contributes to the production of honey. The quality and amount of nectar are also greatly influenced by environmental factors such as temperature, humidity, wind speed, and sunlight. Measuring nectar production in relation to these climates parameters is essential. Knowing how much honey each blooming plant species can produce is important for determining how they affect beehive productivity and for guiding management plans for forests and watersheds. Therefore, this study was aimed to quantify the dynamics of nectar secretion and the honey production potential of Leucas abyssinica. To measure the accumulated nectar volume, a set of flowers was enclosed with mesh bags one day before nectar collection. Nectar volume, concentration, temperature, and humidity were recorded at 4-hour intervals. It was adjusted according to the flower size the species. The collected data were analyzed using one-way ANOVA and linear regression. The results showed significant differences (at p < 0.05) in nectar secretion dynamics at various times of the day. The volume of nectar available between consecutive measurements ranged from from 0.78 to 1.04 (µl) per flower. Nectar concentration varied throughout the day, ranging from 30.35% to 36.79%. Temperature and humidity were negatively correlated with nectar volume and concentration. Based on the average nectar sugar content, the mean honey production potential was estimated at 32.2 kg/ha, with a maximum potential of 110 kg/ha. These findings suggest that L. abyssinica have substantial honey production potential. Therefore, promoting the planting and in-situ conservation of this plant species is recommended to support sustainable honey production.
},
 year = {2025}
}
TY  - JOUR
T1  - Floral Nectar Secretion Dynamics and Honey Production Potential of Leucas abyssinica (LAMIACEAE)

AU  - Shimu Debela Lema
AU  - Tura Bareke
AU  - Admassu Addi
Y1  - 2025/05/24
PY  - 2025
N1  - https://doi.org/10.11648/j.bio.20251303.11
DO  - 10.11648/j.bio.20251303.11
T2  - American Journal of Bioscience and Bioengineering
JF  - American Journal of Bioscience and Bioengineering
JO  - American Journal of Bioscience and Bioengineering
SP  - 28
EP  - 34
PB  - Science Publishing Group
SN  - 2328-5893
UR  - https://doi.org/10.11648/j.bio.20251303.11
AB  - Ethiopia's beekeeping industry benefits immensely from the diverse range of plant species that are supported by the country's ideal environment. However, different plant species produce different amounts of nectar, which has a direct impact on how much honey is produced. Many factors, such as flower shape, flower morphology, flowering phenology, and the amount and quality of nectar produced, affect how much each plant species contributes to the production of honey. The quality and amount of nectar are also greatly influenced by environmental factors such as temperature, humidity, wind speed, and sunlight. Measuring nectar production in relation to these climates parameters is essential. Knowing how much honey each blooming plant species can produce is important for determining how they affect beehive productivity and for guiding management plans for forests and watersheds. Therefore, this study was aimed to quantify the dynamics of nectar secretion and the honey production potential of Leucas abyssinica. To measure the accumulated nectar volume, a set of flowers was enclosed with mesh bags one day before nectar collection. Nectar volume, concentration, temperature, and humidity were recorded at 4-hour intervals. It was adjusted according to the flower size the species. The collected data were analyzed using one-way ANOVA and linear regression. The results showed significant differences (at p < 0.05) in nectar secretion dynamics at various times of the day. The volume of nectar available between consecutive measurements ranged from from 0.78 to 1.04 (µl) per flower. Nectar concentration varied throughout the day, ranging from 30.35% to 36.79%. Temperature and humidity were negatively correlated with nectar volume and concentration. Based on the average nectar sugar content, the mean honey production potential was estimated at 32.2 kg/ha, with a maximum potential of 110 kg/ha. These findings suggest that L. abyssinica have substantial honey production potential. Therefore, promoting the planting and in-situ conservation of this plant species is recommended to support sustainable honey production.

VL  - 13
IS  - 3
ER  -
Oromia Agricultural Research Institute, Holeta Bee Research Center, Holeta, Ethiopia
Oromia Agricultural Research Institute, Holeta Bee Research Center, Holeta, Ethiopia